lines()
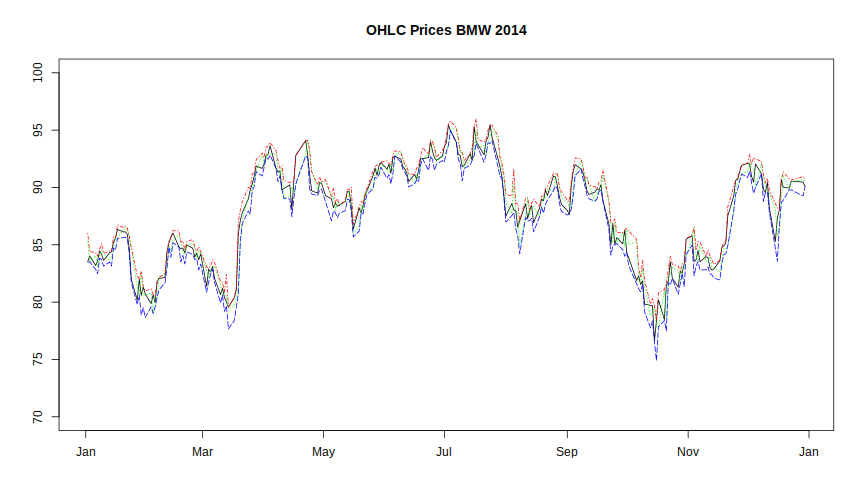
With the lines() function it is possible to plot two or more time series together.
We want the Open, High, Low and Close Prices all together in one plot
and set the limits for the \(y\) - axis to 70 and 100.
> # Creating base plot
>
> plot(x = bmw_2014[,"Date"], y = bmw_2014[,"Close"],
+      type = "l", xlab = "", ylab = "",
+      main = "OHLC Prices BMW 2014", ylim = c(70,100))
>
> # adding lines to the existing plot device
>
> lines(x = bmw_2014[,"Date"], y = bmw_2014[,"Open"],
+       col = "green", lty = "dotted")
> lines(x = bmw_2014[,"Date"], y = bmw_2014[,"High"],
+       col = "red", lty = "dotdash")
> lines(x = bmw_2014[,"Date"], y = bmw_2014[,"Low"],
+       col = "blue", lty = "longdash")